
Data is an asset. What is its value?
- Adam Votava

- Nov 25, 2021
- 7 min read
Thinking about data like an executive.
This article is a translation of Adam Votava's presentation given at Primetime for Big Data 2021 conference.
Intuitively, we all understand that data has value. It’s why companies are investing heavily into data and why so many people have chosen data as their professional career path.
An asset is a resource controlled by the entity as a result of past events and from which future economic benefits are expected to flow to the entity.
But despite data being a valuable asset, we don’t find it represented in balance sheets. Why is that? Doug Laney, author of Infonomics — a book about information monetisation and valuation — links it to 9/11.
The 2001 attack on the World Trade Centre didn’t only lead to tragic losses of lives and property. Large amounts of data, stored on physical servers in the twins, were irreversibly lost too.
This scared insurance companies. Imagine what might have been the value of all the customer lists, historical transactions, and orders! To be on the safe side, they excluded information assets from the insurance policies. And they didn’t lose time putting these wheels in motion — the exclusion of information assets was completed in the month after the attacks. And accountants followed up in 2004 to assert that data doesn’t count (when it cannot be insured).
However, this doesn’t mean that data has no value at all! Rather, its value is an inherent property; not something an authority can decide. It’s up to the market and its participants to determine data’s worth. And so, we see a number of data marketplaces emerging, where companies are selling and buying data sets. Think about it, there are many companies whose product is nothing more than making various types of data available to others.
And data can even be used as collateral, just like United Airlines and American Airlines did during the Covid-19 pandemic. Data from their customer loyalty programs were valued at around $20 billion for each airline.
Isn’t it interesting that what has no value for insurers, has great value (and surety) for banks? But how did they come up with that number? How do we value a data set?
There is a saying that ‘beauty lies in the eye of the beholder’. And it’s pertinent for discussions about the value of data perceived by a buyer and a seller. Often, a seller’s view is often premised on the costs incurred to build a data set and an estimate of the business impact for the buyer. Buyers, on the other hand, are estimating the costs to build (a ‘buy vs. build’ decision) whilst evaluating the possible business impact — which they can often accurately estimate. Resulting in a somewhat symmetrical information asymmetry between sellers and buyers.
How does it work in real life? I’ve seen examples when the value of a data set according to the seller was 10-times higher than as perceived by the buyer. A gap too large to be closed during price negotiations. Though, I’m sure that other potential buyers were more than happy with the same price point. Because, like I said, beauty lies in the eye of the beholder.
But note that both the sellers and the buyers are considering business benefits. That’s because the economic value of data is absolutely key.
We have all seen examples of how data is being used to make better decisions, improve the efficiency of operations, or even generate new revenue streams. All of which has a direct impact on a company’s P&L, and thus its value.
When thinking about economic value, I recommend taking advice from Bill Schmarzo, who is doing a great work in helping us understand the economics of data. He says, that:
“You can’t determine the value of data in isolation of the business.”
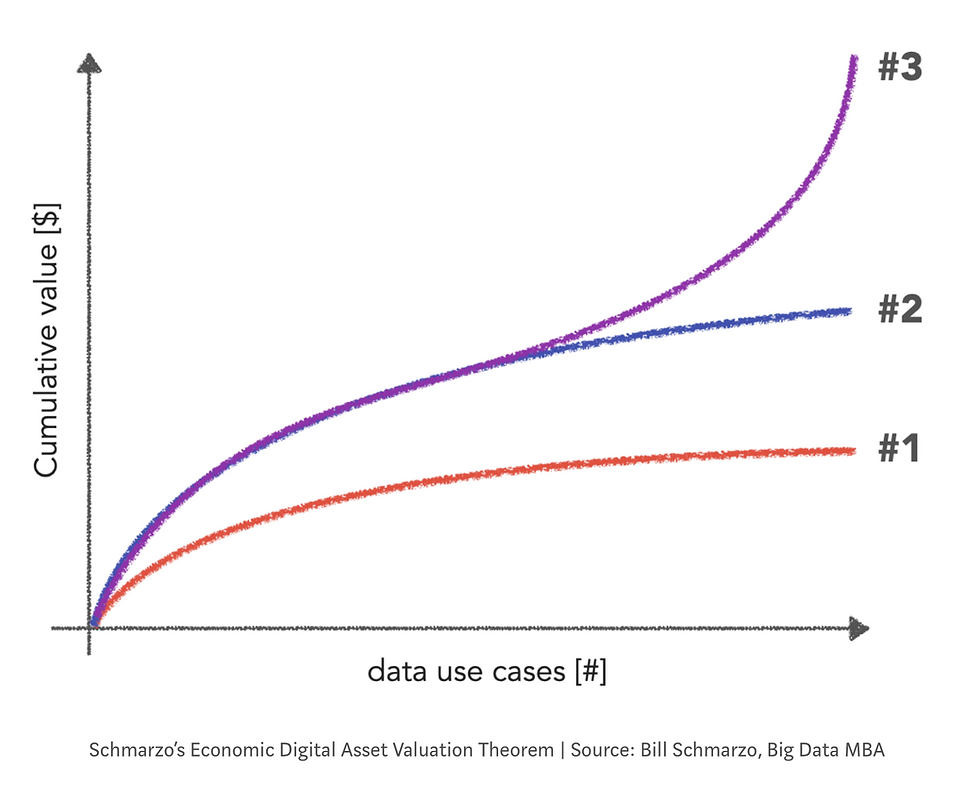
Data has many unique properties — it doesn't deplete, deteriorate, can be used and re-used. Thanks to these, as Bill explains, the more we do with data: marginal costs flatten (effect #1 in the image below) and economic value grows (effect #2).
Moreover, data can also be used for multiple purposes in parallel! Think of a customer data set being used to determine pricing, product recommendation, as well as marketing campaigns to individual customers. When we improve the quality of such customer data set, or we add a new relevant feature, it has an impact on all the data solutions relying on it. And so, the economic value accelerates (effect #3).

So, what are the data use cases on the x-axis?
For me, a data use case, data project, data initiative, or even the whole data strategy is about three questions:
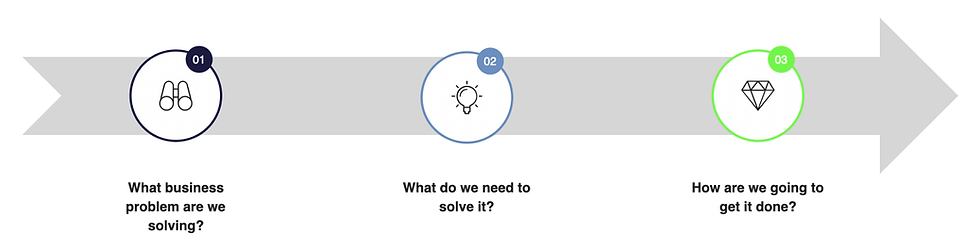
Question one links our data project to the business. And crucially, it also provides a measure for the economic value (e.g., ARR, operational costs, …).
The second question needs to be answered holistically, because we rarely need only data and analytics. We must consider strategic alignment, infrastructure, and probably most importantly people. The answer to this question also gives us a sense of what the investment looks like.
And lastly, the third question forms an actionable plan. And it allows us to sequence the economic benefits and investment over time.
And how does a data investment look over time, I hear you ask? Similar to any other investment — the return on investment into data follows the familiar investment J-curve.
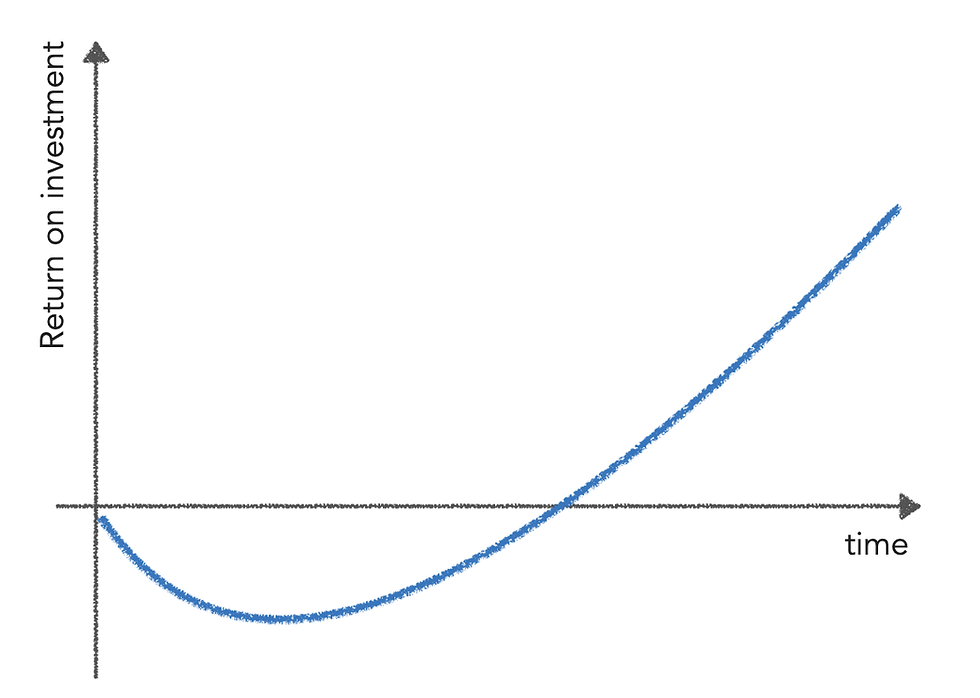
There are two important points to be mentioned here:
Time doesn’t stop. So, if we want to maximise the economic value of data in — let say — a year, we shouldn’t waste six months overthinking what to do.
The shape of the J-curve is only an estimate. Nobody can guarantee that the drop won’t be deeper, or that it will even turn back up, or reach break-even fast enough, or that it will keep growing steeply as expected (and long enough).
The investment J-curve is nothing new. However, investments into data are often not managed as diligently as other investments.
In my professional career I have worked in corporate, consulting, start-up, and private equity environments. Just speaking from my own experience, I offer these observations:
In corporates, we often estimate the future impact to justify the annual budget. The actual impact is rarely measured.
Consultants are ‘selling’ ROI on individual projects, so the client ends up with dozens of ‘J-curves’ (for a churn model, data warehouse, new ERP, Tableau implementation, …) that hard to aggregate and not double count the benefits or miss any investment.
Data investments in start-ups are frequently driven by the impact on valuation during the next investment round. Thus, the realisation of the benefits is often postponed.
Where it seems to be managed diligently is in the private equity space. A private equity investor acquires a company for a valuation driven by key business metrics and the plan is to sell the business with profit in 5–7 years. The key for data investments is therefore to make an impact on these key business metrics. Invest heavily in the first couple of years. See the portfolio company through the J-curve, and sell whilst the company benefits from the upward trajectory (and even leave some value on the table for the next acquirer) to underpin the valuation.
So, how does it look like in a real life?
By way of example let’s consider a SaaS B2B technology business. The business problem (remember the first question defining a data project) shared by most of these companies is to drive ARR (our key business metric) potentially through increased cross sell and up sell.
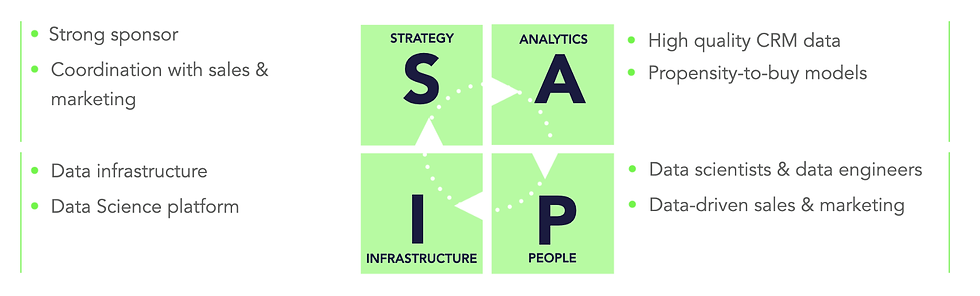
Next, we need to consider what is needed in order to solve that (the second question for data projects). At DataDiligence we are using our SAPI framework to remind ourselves of all the important factors influencing the success of data projects. Let’s see a quick high-level example.
From a strategic perspective, we might need a strong sponsor and tight cooperation between data, sales, and marketing.
When it comes to data and analytics, high quality CRM data and propensity-to-buy models might be required.
We need data professionals to build the x-sell models. And we also need to ensure the sales and marketing teams will be making data-driven decisions and helping to turn propensity scores into sales. And let’s not forget that its people who drive data culture and adoption.
And we obviously need a data infrastructure to run all this. Including a data science platform to build and operate the models.
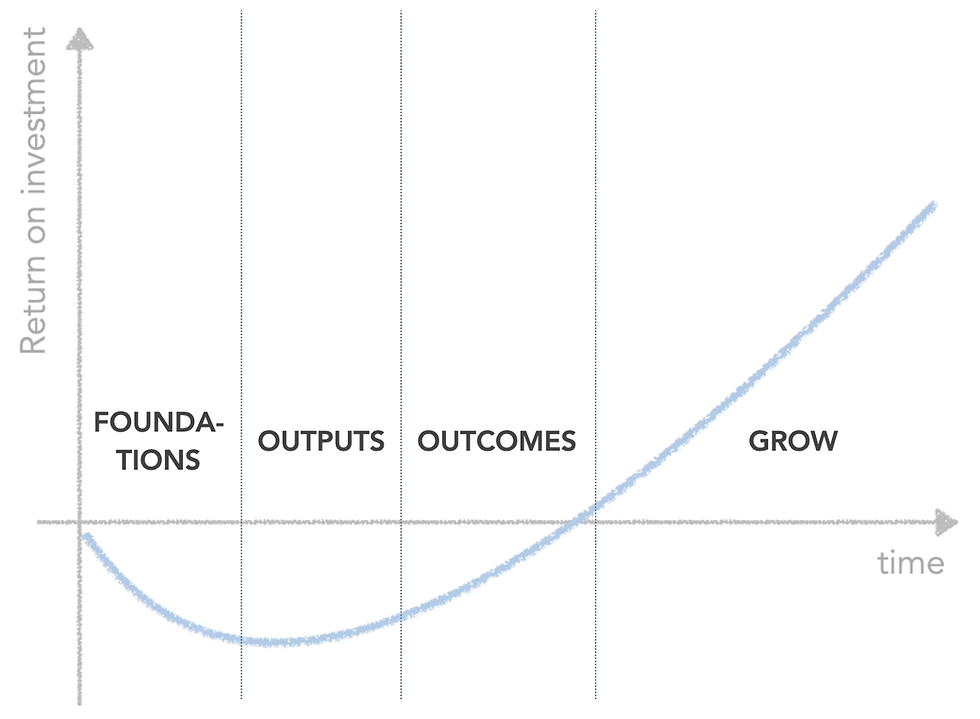
And now to the third question related to data projects — how are we going to get it done? I won’t go into too much detail as this is unique to each situation. But from the perspective of the economic value, the roadmap typically contains four phases.
Firstly, we focus on the foundations — setting up a data infrastructure, getting the data in etc.
Next, we build data outputs — the propensity-to-buy models in our example.
Then we work with sales and marketing colleagues to use these to drive x-sell (the desired business outcome).
And finally, we roll it out and scale the impact as much and for as long as possible.
And because data is a strategic investment and should be treated as such, we need to have an investment plan attached to the roadmap. This typically includes all the investments needed (CAPEX, OPEX, infrastructure, people, …), impact on the key business metric (ARR in this case), and impact on cash flow and EBITDA (for instance), measured by quarters or any other reasonable time period.
Only when we have this can we manage the project properly — balance the investment against the business impact, whilst dealing with the non-linear, R&D-nature of data projects. This way, we can make tactical and operational decisions to get project back on track if needed, and learn from mistakes for the future.
One question I’m always asked is how do I attribute the impact on the business metric with the data project when there are so many other factors at play — other projects, competition, marketing campaigns, general market situation etc. The answer is to use data-driven decision making! In our example, we could use A/B testing, perhaps even including a placebo group. Evaluate them and try to estimate the actual impact of a data project as accurately as possible.
Let’s assume the project goes well and the impact to ARR exceeded the expectations. What next?
To answer this, we need to go back to the economics of data.
And follow these steps to maximise our chances of success:
· Put a data strategy in place to sequence use cases well.
· Start! (Time doesn’t stop.)
· Do one project after another, building on the wins (and lessons) and the data itself.
This is the only way we can systematically realise the economic value of data. And that’s the main thing.
Data is an asset. Sweat it!
***
This article was first published on LinkedIn https://www.linkedin.com/pulse/data-asset-what-itsvalue-adam-votava/?trackingId=ZegWiOMGRn%2BhgYmwVPWjbQ%3D%3D
Unless otherwise stated, images belong to DataDiligence


Comments